

How EV Charging Stations Generate Revenue Through Advertising and Monetization
Aug 25,2026
Many charging site hosts expect electricity sales alone to deliver strong returns. In practice, energy revenue must cover electricity cost, demand charges, network fees, maintenance, and site rent. When utilization stays moderate, the margin can disappoint. At Parwatt I see operators look for additional revenue streams to strengthen the business case.
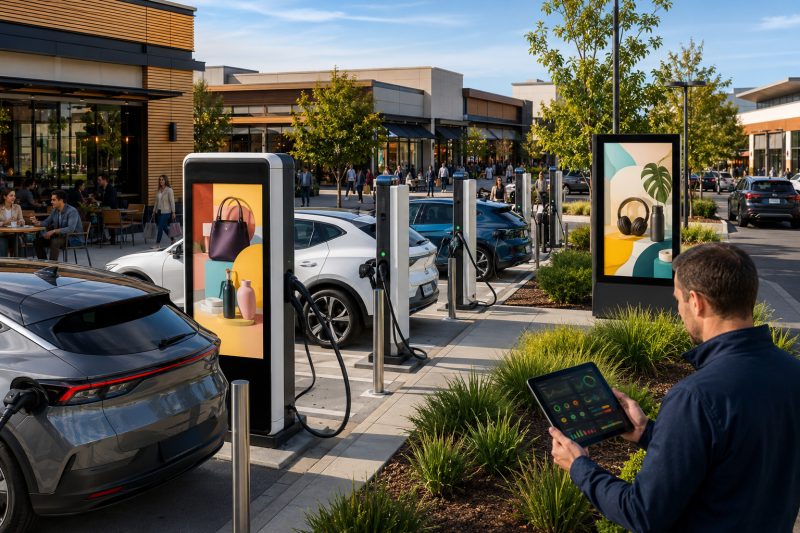
EV charging stations can generate revenue beyond electricity sales through advertising, sponsorships, parking and idle fees, subscriptions, and increased onsite spending. Location, dwell time, screen visibility, and equipment reliability determine how much value these extra streams can create. In 2026 diversified monetization helps sites improve overall returns.
I have worked with charge point operators, retailers, and property owners for years as general manager at Parwatt New Energy. We supply DC chargers and power modules used at commercial and destination sites. I regularly review financial models that relied only on charging fees and later needed additional income sources to meet return targets. Our equipment, including the FES-D30 DC EV Charger and modular systems, is built for the uptime that both energy sales and advertising require. In this article I explain how charging stations can generate revenue through advertising and other monetization methods and how site hosts can build a practical strategy in 2026.
Why Charging Fees Alone May Not Deliver the Expected ROI?
Charging fees must cover more than the wholesale cost of electricity. Demand charges, network and payment processing fees, routine maintenance, software subscriptions, and any ground rent or revenue share all reduce the net margin. When session volume is still growing or pricing is set too low, electricity sales alone can leave the project short of its return target.
Charging fees alone often fall short of expected ROI because operating costs—energy, demand charges, network services, maintenance, and site costs—consume a large share of revenue. Moderate utilization or aggressive pricing further compresses margins, making additional revenue streams valuable for many sites.
The Cost Structure Behind Thin Margins
I have examined operating statements where energy revenue looked healthy until every cost line was included. Demand charges in particular can surprise operators. A few high-power sessions during the utility’s peak window can set a high monthly peak that is billed for the entire period.
Network and payment fees are usually charged per port or per transaction. Over a year they become a meaningful fixed or semi-fixed cost. Maintenance, whether handled internally or through a service contract, adds further expense. Sites that experience frequent faults pay more in both repairs and lost session revenue.
Utilization is the largest variable. A station that delivers only a few sessions per day may cover its variable energy cost yet contribute little toward capital recovery and fixed operating expenses. Early-year utilization is often lower than long-term projections, stretching the payback period.
Pricing strategy also affects results. Rates set too high can reduce session volume. Rates set too low leave insufficient margin after energy and fees. Finding the balance takes time and local market knowledge.
Here is a table that shows why pure charging revenue can disappoint:
| Cost or Factor | Impact on Net Revenue | Typical Effect | Who Feels It Most |
|---|---|---|---|
| Demand charges | Reduces margin on high-power sessions | Monthly bill spikes | DC fast sites |
| Network and payment fees | Ongoing fixed or per-session cost | Lower contribution margin | All networked stations |
| Maintenance and repairs | Direct expense plus lost sessions | Higher operating cost | Sites with uptime issues |
| Moderate utilization | Fewer sessions to spread fixed costs | Longer payback | New or low-traffic locations |
| Site rent or revenue share | Additional deduction from income | Reduced net to operator | Hosted or leased sites |
This table reflects the reality many operators face. At Parwatt we design hardware for high reliability so lost-session costs stay low, yet the broader cost structure still requires careful planning. You can review our commercial solutions in the EV Charger Category.
In 2026 energy margins remain important, but they are rarely the whole story. Sites that treat charging fees as the only revenue source often need to revisit their model once real operating data arrives.
The Monetization Mistakes That Can Undermine a Charging Business
Operators sometimes pursue additional revenue in ways that create new problems. They overestimate charging demand or advertising fill rates. They ignore the revenue loss caused by downtime. They install large screens without checking visibility and foot traffic. They allow advertising to interfere with the charging experience. They leave data privacy, content approval, and revenue-share terms undefined. These mistakes weaken both energy and media income.
Monetization mistakes include overestimating demand and ad fill rates, underestimating downtime losses, installing screens without visibility analysis, allowing ads to degrade the driver experience, and failing to define privacy, content, and revenue-share responsibilities. These errors reduce rather than improve overall returns.
Errors That Damage the Business Case
One common mistake is optimistic forecasting. Session counts and advertising occupancy are projected at high levels from day one. When actual utilization and ad sales ramp more slowly, both energy and media revenue fall short of the model.
Downtime is frequently under-weighted. A charger that is offline generates neither energy revenue nor reliable ad impressions. It can also damage driver trust and reduce repeat visits. Media partners expect the screen to be available; repeated outages can void commitments or lower future rates.
Screen placement is sometimes driven by aesthetics or available mounting points rather than audience visibility. A display that faces away from pedestrian flow or is readable only by the single driver at the stall delivers limited advertising value even if charging utilization is strong.
Overly aggressive advertising can annoy drivers. Long video ads that delay the start of charging, excessive brightness at night, or irrelevant content create negative experiences that show up in reviews and reduce loyalty.
Legal and commercial terms are often left vague. Questions of who approves content, who is responsible for privacy compliance, how revenue is calculated and shared, and what happens if the screen or charger fails need clear answers before launch.
Here is a table of the main monetization traps:
| Mistake | Why It Happens | Result | Better Practice |
|---|---|---|---|
| Over-optimistic forecasts | Pressure to justify investment | Revenue shortfalls | Use conservative utilization and fill rates |
| Ignoring downtime impact | Focus on potential upside | Lost energy and ad income | Prioritize uptime and rapid repair |
| Poor screen placement | Convenience of installation | Low media value | Design for visibility and dwell |
| Ads that harm experience | Maximizing ad load | Driver dissatisfaction | Keep charging flow primary |
| Undefined commercial terms | Desire to move quickly | Later disputes | Document approval, privacy, and sharing |
This table highlights issues I see when reviewing under-performing media-enabled sites. At Parwatt we emphasize reliable hardware, including systems built around our 30kW Power Module and 40kW Power Module, because uptime underpins every revenue stream.
I have watched sites install impressive screens only to discover that few pedestrians ever looked at them. I have also seen drivers complain when the charging interface felt secondary to advertising. Monetization works best when it respects the primary purpose of the stop.
The Main Revenue Models Available to EV Charging Site Hosts
Site hosts can combine several revenue types. Energy sales remain the foundation. Parking fees, idle fees, and subscriptions add further direct income. Digital advertising, sponsorships, and local promotions create media value. Increased foot traffic and onsite spending generate indirect commercial returns. The strongest models usually blend two or more of these streams.
Main revenue models include charging fees based on energy, time, or session, parking and idle charges, membership subscriptions, digital advertising and sponsorships, and indirect gains from higher foot traffic and onsite spending. The mix should match the site’s dwell time, audience, and operating costs.
Direct and Indirect Revenue Options
Energy-based pricing charges by the kilowatt-hour. Time-based pricing charges by the minute or hour. Session fees apply a flat amount per use. Each approach suits different dwell patterns and competitive environments. Most commercial sites also add idle fees to encourage turnover once charging is complete.
Parking charges can apply whether or not the vehicle is charging, especially in constrained urban locations. Subscriptions or membership plans offer drivers discounted rates or reserved access in exchange for recurring fees, improving revenue predictability.
Digital advertising turns the charger screen or nearby display into media inventory. Third-party campaigns, local business promotions, and sponsorships can all run on the same screen. Networked systems allow content to change by time of day, location, or campaign.
Sponsorships provide another layer. A brand may underwrite part of the station cost or ongoing operations in exchange for prominent, longer-term presence.
Indirect value arises when charging brings drivers into a retail, dining, or service environment and encourages them to spend while they wait. Loyalty programs and targeted offers can strengthen this effect.
Here is an overview of the primary models:
| Revenue Type | How It Works | Best Fit Sites | Key Requirement |
|---|---|---|---|
| Energy / time / session fees | Driver pays for charging | All commercial sites | Competitive yet sustainable pricing |
| Parking and idle fees | Charges for space occupation | High-demand or constrained lots | Clear rules and enforcement |
| Subscriptions | Recurring driver payment | Workplace, multifamily, loyal users | Perceived value and convenience |
| Digital advertising | Paid campaigns on screens | High-visibility, longer-dwell locations | Audience and viewability |
| Sponsorships | Brand underwriting or presence | Signature or high-traffic sites | Brand alignment |
| Onsite spend lift | Drivers buy food, retail, services | Retail, QSR, destinations | Easy access from charger to store |
This range gives site hosts flexibility. At Parwatt we see operators combine energy revenue with media and dwell-time benefits most successfully when the hardware stays reliable. Our solutions, including the Battery Buffered Ultra Rapid EV Charger, support the continuous operation these models need.
I recommend that every site map its natural dwell time and customer flow before choosing the revenue mix. A model that works at a quick-service restaurant may fail at an office parking facility, and the reverse is equally true.
Why Location, Dwell Time and Audience Quality Determine Advertising Value
Advertising revenue depends on more than the number of charging sessions. Screen visibility to both drivers and passers-by, the length of time people remain in view, the commercial intent of the audience, and the ability to prove that ads were delivered all influence what advertisers will pay. A high-utilization charger in a poor media position may generate less advertising income than a moderate-utilization charger with excellent visibility and dwell.
Advertising value is driven by location quality, dwell time, audience profile, and measurable delivery rather than charging volume alone. Screens that are highly visible to pedestrians and vehicles, in environments with commercial intent, and supported by reliable proof-of-play data command stronger rates.
The Factors That Create Media Value
Visibility is foundational. A screen that faces pedestrian walkways, queue lines, or vehicle approach lanes reaches more eyes than one visible only to the single driver standing at the stall. Mounting height, angle, brightness, and obstruction all affect real-world viewability.
Dwell time determines how much of a message can be absorbed. Longer stays at Level 2 sites or destination locations allow richer creative and repeated exposures. Very short DC fast stops limit message length and complexity.
Audience quality matters to advertisers. Drivers and visitors at grocery stores, shopping centers, and lifestyle destinations often have higher purchase intent than those at pure transit stops. Local businesses especially value proximity to potential customers.
Technical capability supports higher rates. Networked systems that can update content by time, location, or campaign, and that provide verifiable play logs, meet the expectations of professional media buyers. Static or manually updated screens offer less flexibility and lower accountability.
Here is a comparison of media-value drivers:
| Factor | High-Value Condition | Low-Value Condition | Impact on Rates |
|---|---|---|---|
| Visibility | Clear to pedestrians and approaching vehicles | Visible mainly to one driver | Strong difference |
| Dwell time | Several minutes or longer | Under one minute | Affects creative and pricing |
| Audience intent | Shopping, dining, services nearby | Pure transit or isolated lot | Higher advertiser interest |
| Proof of delivery | Automated logs and reporting | Manual or no verification | Required by many buyers |
| Content flexibility | Networked, dynamic updates | Static or infrequent changes | Increases inventory usefulness |
This framework helps sites evaluate whether advertising is a realistic secondary revenue stream. At Parwatt we focus on the reliability of the underlying charging system because a screen on an offline charger delivers neither energy nor media value. Additional system guidance appears in our article on Electric Vehicle Charging.
I have seen well-placed screens at destination retail sites generate meaningful media interest even when charging volume was only moderate. I have also seen high-throughput corridor chargers produce little advertising income because the screens faced the wrong direction or were readable only by the driver. Media value must be assessed on its own terms.
How to Build and Measure a Profitable EV Charging Revenue Strategy
A profitable strategy starts with realistic assumptions about utilization and cost. Site hosts then select a combination of revenue streams that fit the location’s dwell time and audience. Advertising, if used, is sold through clear channels with defined terms. A small pilot validates the model before wider rollout. Continuous measurement of both charging and media performance guides expansion and adjustment.
Build a profitable revenue strategy by analyzing traffic and dwell patterns, constructing a complete cost model, choosing complementary revenue streams, defining advertising sales and terms, piloting at limited sites, and tracking utilization, uptime, energy margin, ad fill, and onsite conversion. Data-driven expansion follows successful pilots.
Practical Steps from Analysis to Scale
Begin with site analysis. Estimate vehicle and pedestrian traffic, typical dwell times, and nearby commercial activity. These inputs determine whether energy sales, media, onsite conversion, or a blend will form the core of the model.
Build a full cost picture. Include energy, demand charges, network fees, maintenance, software, any site rent, and the capital recovery required. Only then can incremental revenue streams be evaluated properly.
Select the revenue mix. Match charging speed and pricing to dwell time. Add parking or idle fees where turnover matters. Introduce advertising or sponsorships only where visibility and audience quality support them. Design offers that encourage onsite spending while drivers wait.
Define advertising operations clearly. Decide whether sales will be handled in-house, through a media partner, or via programmatic platforms. Establish content guidelines, approval processes, privacy rules, and revenue-share percentages before any screen goes live.
Pilot on a limited number of stalls or sites. Measure actual session volume, energy margin, uptime, advertising fill rate, revenue per screen, and any observable lift in onsite transactions. Compare results with the original assumptions.
Scale only what the data supports. Expand the successful elements and adjust or drop the under-performing ones. Continuous monitoring keeps the model aligned with real conditions.
Here is a practical implementation checklist:
- Analyze vehicle traffic, pedestrian flow, and dwell times.
- Construct a complete operating and capital cost model.
- Match charging technology and pricing to site behavior.
- Decide which additional streams (idle fees, ads, sponsorships, onsite offers) fit the location.
- Define advertising sales channels, content rules, privacy, and revenue share.
- Launch a limited pilot with clear measurement.
- Track uptime, utilization, energy margin, ad fill, and conversion indicators.
- Expand or adjust on the basis of pilot results.
- Maintain reliability as the foundation of every revenue stream.
At Parwatt we help site hosts choose hardware that stays online and supports both energy and secondary monetization. Our power modules and complete chargers are selected for the durability public and commercial sites require. Further reading on technology selection is available in our comparison of AC vs DC EV Charging.
Operators who treat monetization as a tested portfolio rather than a single optimistic projection consistently achieve more stable results. Reliability, realistic forecasting, and continuous measurement remain the foundations of a durable charging business.
Conclusion
EV chargers can generate value through more than the electricity delivered to drivers. At Parwatt we design chargers and power modules for the uptime that makes every revenue stream possible. Charging fees, parking and idle charges, subscriptions, digital advertising, sponsorships, loyalty programs, and additional onsite spending can form a diversified revenue model. However, each opportunity depends on the location, charging speed, dwell time, audience visibility, operating costs, and reliability of the equipment. A screen does not automatically create a viable media business, just as a busy parking lot does not guarantee profitable charging. Site hosts should begin with realistic utilization and cost assumptions, select revenue streams that complement the customer journey, and measure both direct charging income and indirect commercial value. The strongest strategy is usually a carefully tested combination rather than dependence on one source of revenue.

--- END ---
Related Posts
Business Ideas

Business Ideas

Maximum PSI vs. Airflow: What Really Determines Tire Inflator Performance?
September 08, 2026
Business Ideas

Sourcing Portable Tire Inflators from China: A 2026 B2B Buyer’s Guide
September 07, 2026

Business Ideas

