

Calculating ROI for Commercial EV Charging Installations
Aug 06,2026
Most commercial EV charging ROI calculations look too simple. They count hardware cost and assume high utilization while missing demand charges, real installation expenses, and low early usage. The numbers then disappoint after the stations go live. At Parwatt I see these incomplete models lead to poor investment decisions every year.
Calculating ROI for commercial EV charging requires a complete view of capital costs, operating expenses, realistic utilization, incentives, and both direct and indirect returns. In 2026 accurate models that include demand charges, electrical upgrades, and site-specific traffic produce far more reliable payback projections than simple hardware-plus-ideal-revenue estimates.
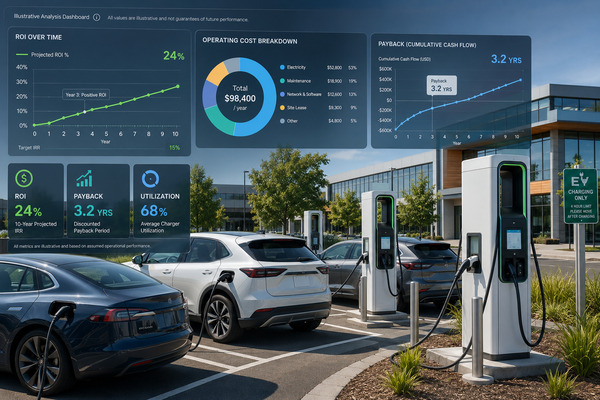
I have worked with charge point operators, real estate developers, and fleet managers for years as general manager at Parwatt New Energy. We supply DC chargers and power modules used in commercial installations. I regularly review financial projections that looked attractive on paper yet failed to match reality once demand charges, low early utilization, and full installation costs appeared. Our products such as the FES-D30 DC EV Charger and modular systems are designed to support efficient operation, yet the business case still depends on honest numbers. In this article I explain how to calculate true ROI for commercial EV charging projects in 2026 and how to avoid the most common errors.
Why Most Commercial EV Charging ROI Calculations Miss the Real Numbers?
Many projections focus only on charger hardware price and an optimistic number of daily sessions. They understate electrical upgrades, trenching, and permitting. They ignore or lightly treat demand charges. They assume utilization that the site cannot reach in the first years. The result is an inflated return that later disappoints.
Most commercial EV charging ROI models miss key costs and overstate early revenue. Incomplete capital figures, overlooked demand charges, and unrealistic utilization assumptions produce payback periods that prove too short once the station operates. A complete model is required for sound decisions.
Where the Standard Calculations Go Wrong
I have examined dozens of project spreadsheets. The hardware line is usually accurate. The installation line is often too low because it omits panel upgrades, transformer work, or long conduit runs. Soft costs such as engineering, permitting, and utility coordination are sometimes missing entirely.
Utilization is the largest source of error. Projections frequently assume 30–40 percent utilization from day one. Real workplace or destination sites often start lower and climb only after drivers form habits and awareness grows. When revenue is calculated on the high number, the payback looks short. Actual cash flow in the first two years is weaker.
Demand charges receive too little attention. For DC fast charging especially, the peak power draw can trigger substantial monthly charges that erase most of the energy margin. Models that treat electricity as a simple per-kWh cost miss this effect.
Indirect benefits are either ignored or given vague high values. Tenant retention, longer customer dwell time, and property value support can be real, yet they need conservative and site-specific estimates rather than generic claims.
Here is a table of the most frequent gaps in ROI models:
| Missing or Distorted Element | Typical Error | Impact on Projected ROI | Reality Check Needed |
|---|---|---|---|
| Electrical and civil work | Under-estimated or omitted | Capital cost too low | Detailed site assessment |
| Demand charges | Ignored or averaged away | Operating cost too low | Utility rate analysis |
| Early utilization | Set too high too soon | Revenue too high | Conservative ramp-up scenarios |
| Soft costs and contingencies | Left out | Total investment understated | Full project budget |
| Indirect benefits | Either zero or exaggerated | Incomplete picture | Site-specific evidence |
This table reflects the patterns I encounter. At Parwatt we encourage partners to build complete cost pictures when they evaluate our equipment, including options in the EV Charger Category. Accurate inputs protect both the operator and the long-term reputation of the charging investment.
In 2026 the gap between simple models and real performance remains wide. Operators who continue to use incomplete calculations risk approving projects that later under-perform or rejecting projects that would have succeeded with better energy management and realistic assumptions.
The Common Traps That Inflate Costs or Underestimate Returns
Several recurring traps distort ROI numbers. Some inflate the capital side without need. Others understate operating costs or overstate revenue. A few ignore incentives that can materially change the net investment. Recognizing these traps improves the quality of every projection.
Common traps include under-estimating electrical upgrades, ignoring demand charges, assuming high utilization too early, overlooking available incentives, and either dismissing or over-claiming indirect benefits. Each trap moves the projected payback away from what the site will actually deliver.
Traps That Distort the Business Case
One frequent trap is treating the charger price as the main capital cost. In many sites the electrical infrastructure work costs as much as or more than the hardware. Long conduit runs, panel upgrades, and utility interconnection fees add large sums that must be included.
Demand charges form another major trap. Operators model electricity as a flat energy cost and then face monthly peaks that consume the margin. Without load management or careful power sizing, DC fast charging projects are especially exposed.
Utilization assumptions are often too aggressive. A site that will realistically see 4–6 Level 2 sessions per day is modeled at 10–12. The revenue line looks strong until actual traffic appears.
Incentives are sometimes left out of the base case or treated as uncertain. Federal, state, and utility programs can reduce net capital by thousands of dollars per port. Ignoring them makes the project look weaker than it is. At the same time, counting incentives that the site cannot actually claim creates the opposite error.
Indirect benefits are handled inconsistently. Some models give them no value. Others add large property-value uplifts without evidence. Both extremes reduce the usefulness of the calculation.
Here is a table of the main traps and their effects:
| Trap | How It Appears in the Model | Distortion Created | Correction |
|---|---|---|---|
| Incomplete installation cost | Hardware dominates the capital line | Understated investment | Full site-specific quote |
| Demand charges ignored | Only energy cost included | Overstated margin | Model peak demand under real rates |
| High early utilization | Aggressive sessions per day | Overstated revenue | Use conservative ramp-up cases |
| Incentives omitted or overstated | Net capital wrong | Incorrect payback | Verify eligible programs only |
| Indirect benefits extreme | Zero or very large uplift | Skewed total return | Conservative, evidence-based estimates |
This table helps teams audit their own spreadsheets. At Parwatt we see better decisions when operators correct these items before they select hardware such as the 30kW Power Module or 40kW Power Module.
I have reviewed projects that looked marginal until incentives and realistic load management were included, and others that looked excellent until demand charges were modeled correctly. The difference between a useful ROI calculation and a misleading one is usually the completeness of the inputs rather than the complexity of the math.
A Practical Framework for Calculating True ROI of Commercial EV Charging
A workable ROI framework organizes every major cash flow into clear categories. It starts with full capital cost, adds realistic operating expenses, projects direct charging revenue under conservative utilization, layers in verified incentives, and finally considers indirect benefits with appropriate caution. Multiple scenarios keep the projection honest.
A practical ROI framework includes complete capital costs, ongoing operating expenses, direct charging revenue under realistic utilization, verified incentives, and carefully estimated indirect benefits. Running base, conservative, and optimistic scenarios produces a decision-ready range rather than a single fragile number.
Step-by-Step Structure
First calculate total installed cost. Include charger hardware, software or network fees if capitalized, electrical upgrades, civil work, permitting, engineering, and a contingency. Separate the numbers for Level 2 and DC fast because their cost structures differ sharply.
Next list annual operating costs. The largest items are electricity (energy plus demand charges), network or payment processing fees, maintenance and repairs, and any site lease or revenue-share payments. Demand charges deserve their own line so they remain visible.
Project direct revenue from charging. Choose a pricing model (per kWh, per minute, session fee, or hybrid) that fits the site. Apply a realistic utilization rate and a ramp-up schedule for the first years. Subtract the energy cost to obtain gross margin before demand charges and other fees.
Subtract the full operating costs from gross margin to reach net operating income. Apply any available incentives as a reduction in net capital or as a year-one cash inflow, depending on how the program pays.
Finally consider indirect benefits. Tenant retention, increased dwell time, or property value support can be included when the site has evidence for them. Keep these figures conservative and show the ROI both with and without them.
Here is a simplified framework outline:
| Category | Key Components | Notes for Accuracy |
|---|---|---|
| Capital cost | Hardware, installation, electrical, soft costs, contingency | Use site-specific quotes |
| Operating cost | Energy, demand charges, network fees, maintenance | Separate demand charges |
| Direct revenue | Sessions × energy or time price | Conservative utilization and ramp-up |
| Incentives | Rebates, credits, grants | Only verified eligible amounts |
| Indirect benefits | Retention, dwell time, value uplift | Optional and conservative |
| Scenarios | Base / conservative / optimistic | Shows range of outcomes |
This structure keeps the calculation transparent. At Parwatt we help operators gather the hardware and performance data needed for the capital and operating sections when they evaluate solutions such as the Battery Buffered Ultra Rapid EV Charger. Additional background on system choices appears in our article on Electric Vehicle Charging.
I recommend building the model so that utilization, electricity rates, and demand charges can be adjusted easily. After the station opens, replace the assumptions with real data. The ROI calculation then becomes a living management tool rather than a one-time justification.
Level 2 vs DC Fast Charging: Side-by-Side ROI Drivers and Payback Realities
Level 2 and DC fast charging produce different ROI profiles. Level 2 has lower capital cost, lower exposure to demand charges, and more modest revenue per session. DC fast charging requires much higher investment and careful energy-cost control but can generate more revenue per hour when utilization is strong. The right choice depends on site traffic, dwell time, and electrical capacity.
Level 2 charging typically offers lower capital cost, simpler energy economics, and payback in the 3–7 year range when incentives and moderate utilization are present. DC fast charging needs higher utilization and active demand-charge management to deliver attractive returns, yet it can serve high-turnover sites more effectively.
Comparative Economics
Capital cost per port is the first clear difference. Commercial Level 2 installations often fall in a lower range once hardware and standard installation are included. DC fast charging ports, especially higher-power units, require substantially more capital because of the charger itself and the heavier electrical infrastructure.
Utilization requirements also differ. Level 2 can reach acceptable returns with a moderate number of longer sessions, such as workplace charging during the day. DC fast charging usually needs higher daily energy throughput to justify the investment. Sites with short dwell times and high traffic are better candidates.
Demand charges affect the two technologies unevenly. Level 2 loads are smaller and less likely to set large peaks. DC fast charging can create sharp peaks that drive up the monthly bill unless load management or battery buffering is used.
Revenue per session is higher with DC fast charging because more energy is delivered in less time. However, the margin after electricity and demand charges must still cover the larger capital recovery.
Here is a side-by-side view of the main ROI drivers:
| Factor | Level 2 | DC Fast Charging | Implication for ROI |
|---|---|---|---|
| Capital cost per port | Lower | Much higher | Level 2 easier to justify at moderate traffic |
| Typical utilization need | Moderate | Higher | DC fast needs strong, consistent demand |
| Demand charge exposure | Lower | Higher | Load management critical for DC fast |
| Revenue per session | Lower | Higher | DC fast can earn more when busy |
| Payback sensitivity | More forgiving | Highly sensitive to utilization and energy cost | Site selection matters more for DC fast |
| Best-fit sites | Workplace, multifamily, destination | Travel corridors, high-turnover retail, fleets | Match technology to dwell time and volume |
This comparison helps operators avoid forcing the wrong technology onto a site. At Parwatt we supply both modular power solutions and complete chargers so customers can match equipment to the economic reality of each location. You can review options in the EV Charger Category.
I have seen Level 2 projects deliver solid returns with modest traffic and good incentives. I have also seen DC fast projects succeed when the site had reliable high utilization and active energy management. The same hardware in the wrong location produces weak ROI. Technology choice and site selection must be made together.
How to Improve Your Projected ROI Before and After Installation
ROI is not fixed at the moment of installation. Operators can improve the numbers before construction by securing incentives, optimizing the design, and setting realistic pricing. After launch they can raise utilization, control energy costs, and refine pricing based on real data. Continuous attention turns a marginal projection into a stronger result.
Improve ROI by maximizing verified incentives, designing for efficient energy use, choosing high-potential locations, setting appropriate pricing, and using software to monitor utilization and costs after launch. These actions raise returns both in the planning stage and during ongoing operation.
Actions That Strengthen the Business Case
Before installation, pursue every applicable incentive. Federal, state, utility, and local programs can reduce net capital significantly. Confirm eligibility and application timelines early so the project schedule aligns with funding requirements.
Design the electrical system with load management in mind. Dynamic power sharing, power limits during peak utility periods, and, where appropriate, battery buffering reduce demand charges and protect margins. Selecting efficient hardware further lowers energy losses.
Location and visibility matter. Sites with natural dwell time or high EV traffic generate utilization faster. Clear signage and easy access improve session counts.
Pricing should reflect both cost recovery and local willingness to pay. Energy-based, time-based, or hybrid models each have strengths. Idle fees can improve turnover at busy sites.
After launch, replace assumptions with data. Track utilization by day and hour, measure actual demand charges, and compare energy cost to revenue. Adjust pricing, power limits, or marketing based on what the numbers show.
Here is a practical improvement checklist:
- Secure and document all eligible incentives before final investment decision.
- Design load management and peak-power controls into the system.
- Choose locations with proven or strongly indicated EV traffic and dwell time.
- Set pricing that covers energy, demand, network, and maintenance costs.
- Install monitoring that reports utilization, energy, and peak demand.
- Review actual performance monthly and refine pricing or controls.
- Re-run the ROI model with real data after the first 6–12 months.
At Parwatt we support operators with hardware that enables efficient operation and clean data for these reviews. Our power modules and chargers, including the Battery Buffered Ultra Rapid EV Charger, help sites manage energy costs while delivering reliable service. Further reading on system design is available in our comparison of AC vs DC EV Charging.
Operators who treat ROI as a living calculation rather than a static approval document consistently achieve better outcomes. The combination of careful planning and active management after launch turns commercial EV charging from a hopeful expense into a measured asset.
Conclusion
Calculating ROI for commercial EV charging is not a simple “cost divided by revenue” exercise. It requires a complete picture of capital costs (including electrical upgrades), ongoing operating expenses (especially demand charges), realistic utilization assumptions, available incentives, and the often-overlooked indirect benefits such as tenant attraction, longer dwell times, and property value uplift. At Parwatt we help operators build realistic models when they evaluate our chargers and power modules. Operators who model multiple scenarios, leverage incentives aggressively, and manage energy costs intelligently consistently achieve stronger returns. Treat the calculation as a living tool—update it with real utilization and cost data after launch—and your commercial EV charging investment can move from uncertain expense to measurable, scalable asset.

--- END ---
Related Posts
Business Ideas

Industry News

Business Ideas

Business Ideas


